
Most Americans seem unaware that individual and corporate tax rates are the lowest in 75 years
Below is a clean, data-driven summary (1950–2026, USA) using representative benchmark years (since yearly statutory structures are complex and bracketed).
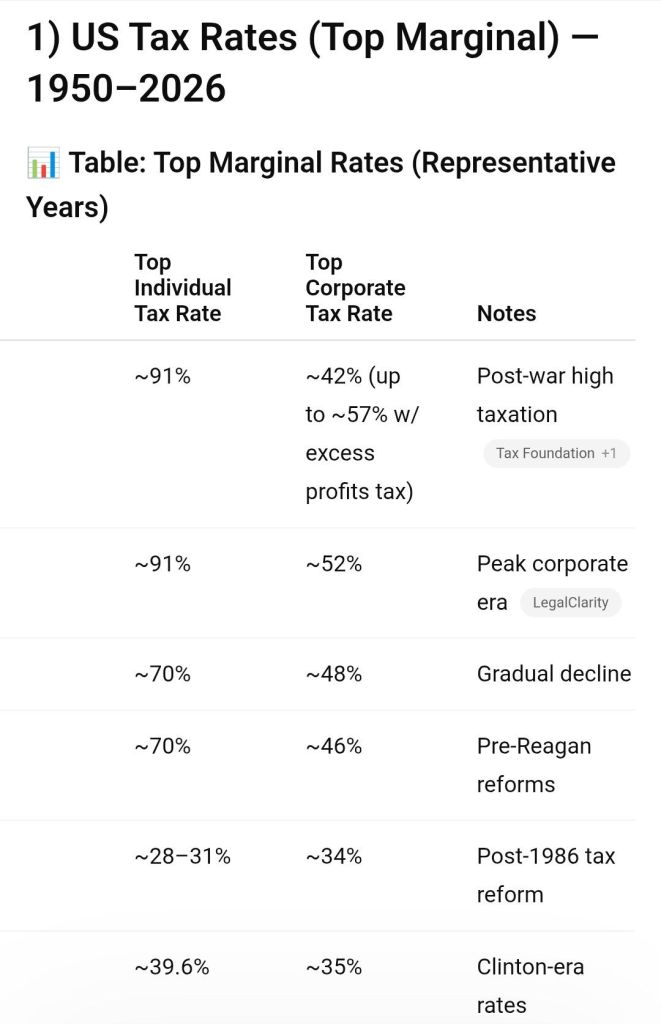
- A table (individual vs corporate rates
- A middle-class share table + graph
- Key interpretation
1) US Tax Rates (Top Marginal) — 1950–2026
Key Takeaways
- Individual rates dropped dramatically from ~90% → ~37%
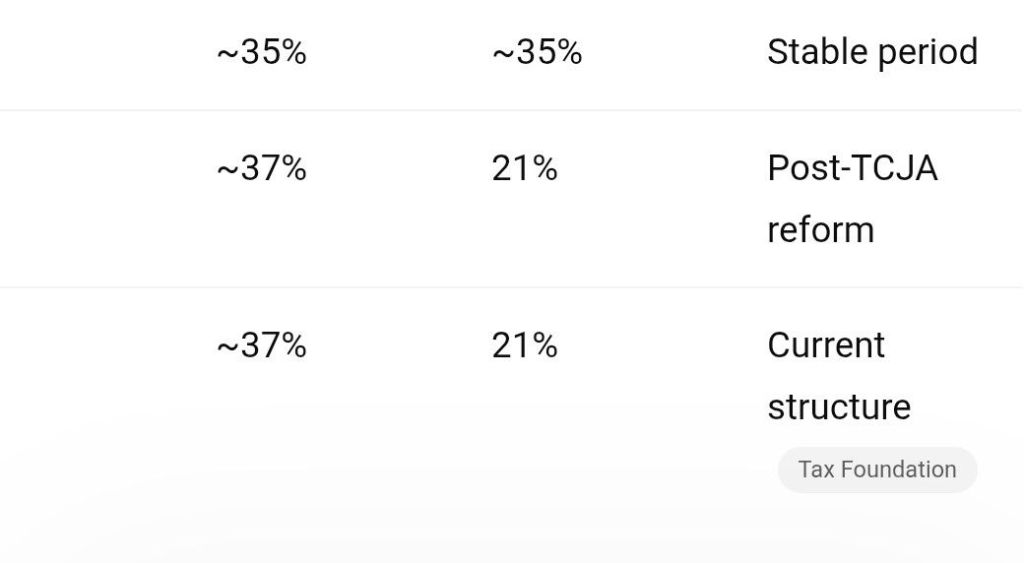
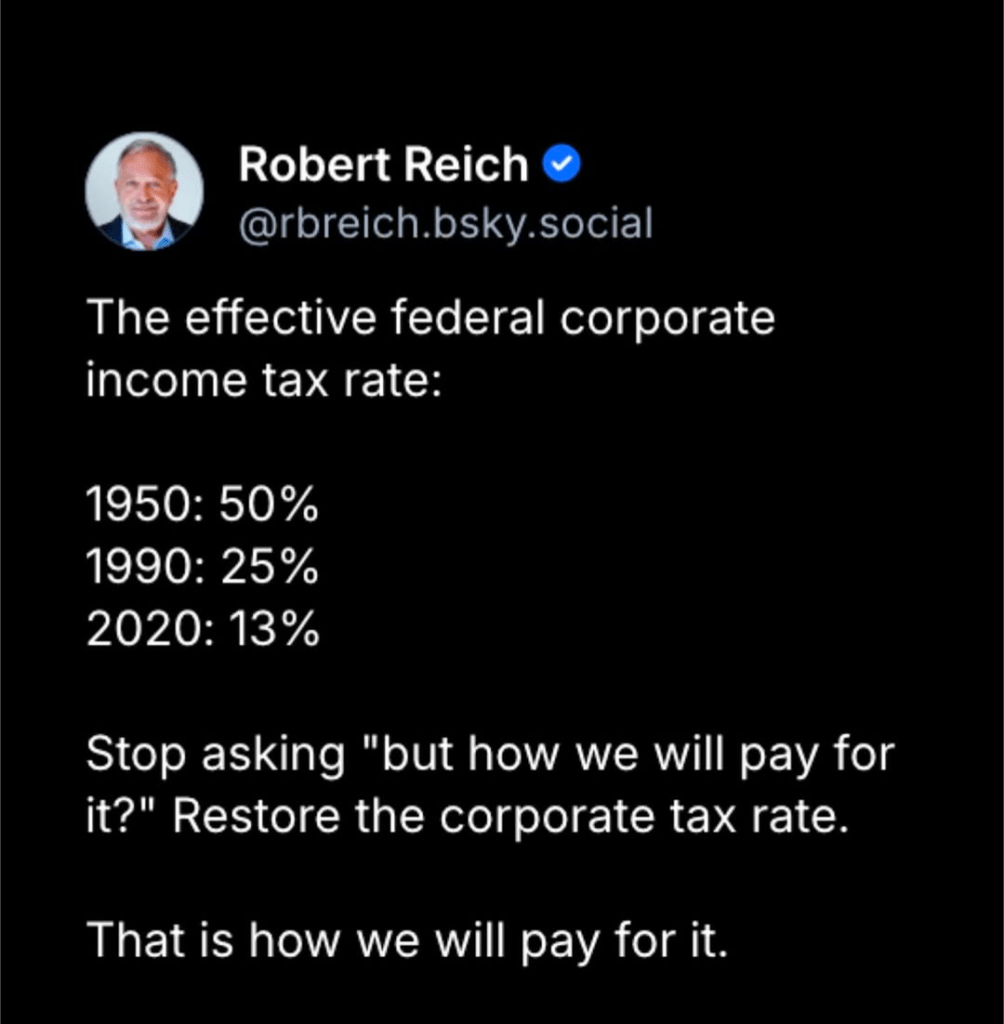
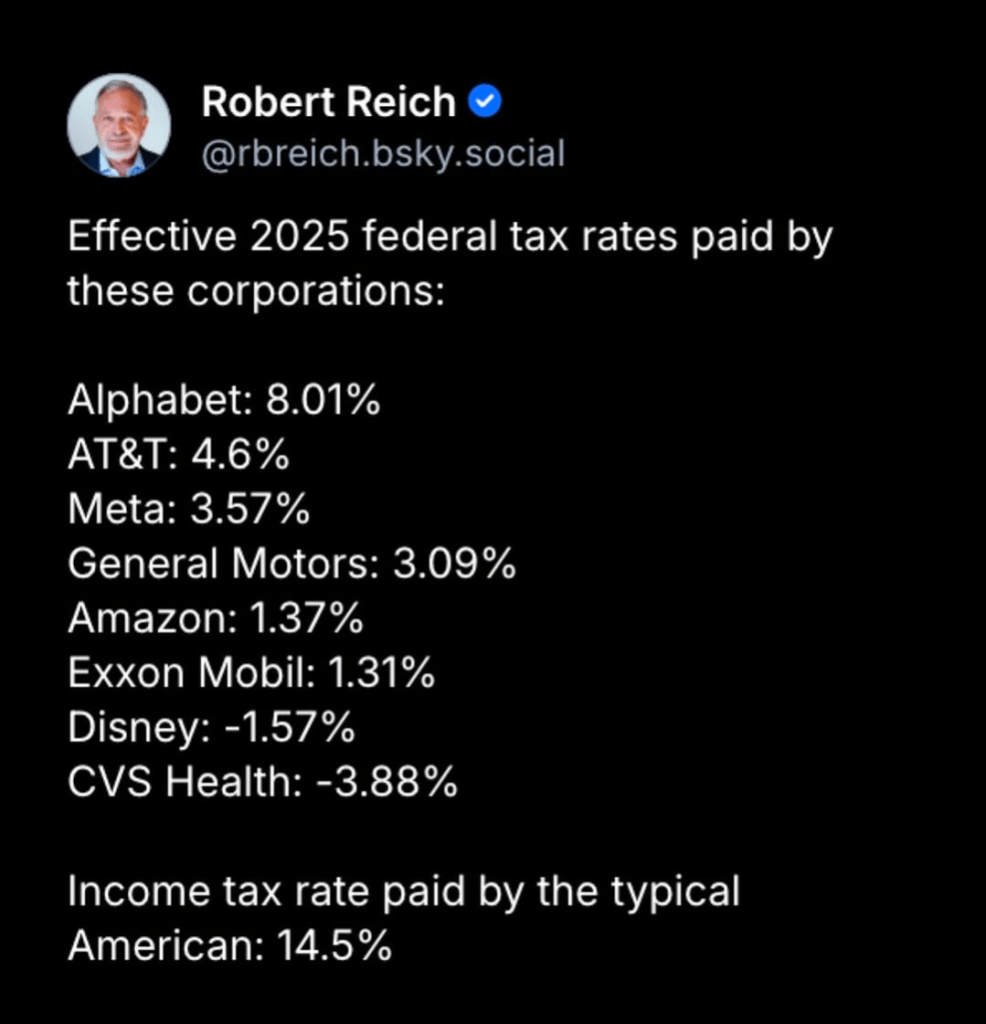
- Corporate rates dropped from ~50% → 21%
- Biggest structural break: Tax Cuts and Jobs Act (2017) → flat 21% corporate rate
3) Middle Class Size (Share of Population)
Trend:
- Peak: post-WWII (~1950–1970)
- Steady decline since ~1980
4) 📉 Graph: Middle Class Shrinkage
% of Population
70 |  ████████████
65 |  ███████████   (1950 peak)
60 |  ██████████
55 |  █████████
50 |  ████████
45 |
    ----------------------------------------
     1950   1970   1990   2010   2026
5) Interpretation (Important Context)
🧾 Taxes vs Reality
- While statutory rates were extremely high in the 1950s, effective rates were much lower due to deductions and loopholes
- Example: top earners paid closer to 35–45% effective, not 90%+
🏢 Corporate Taxes
- 1950s–60s: high statutory rates + war taxes
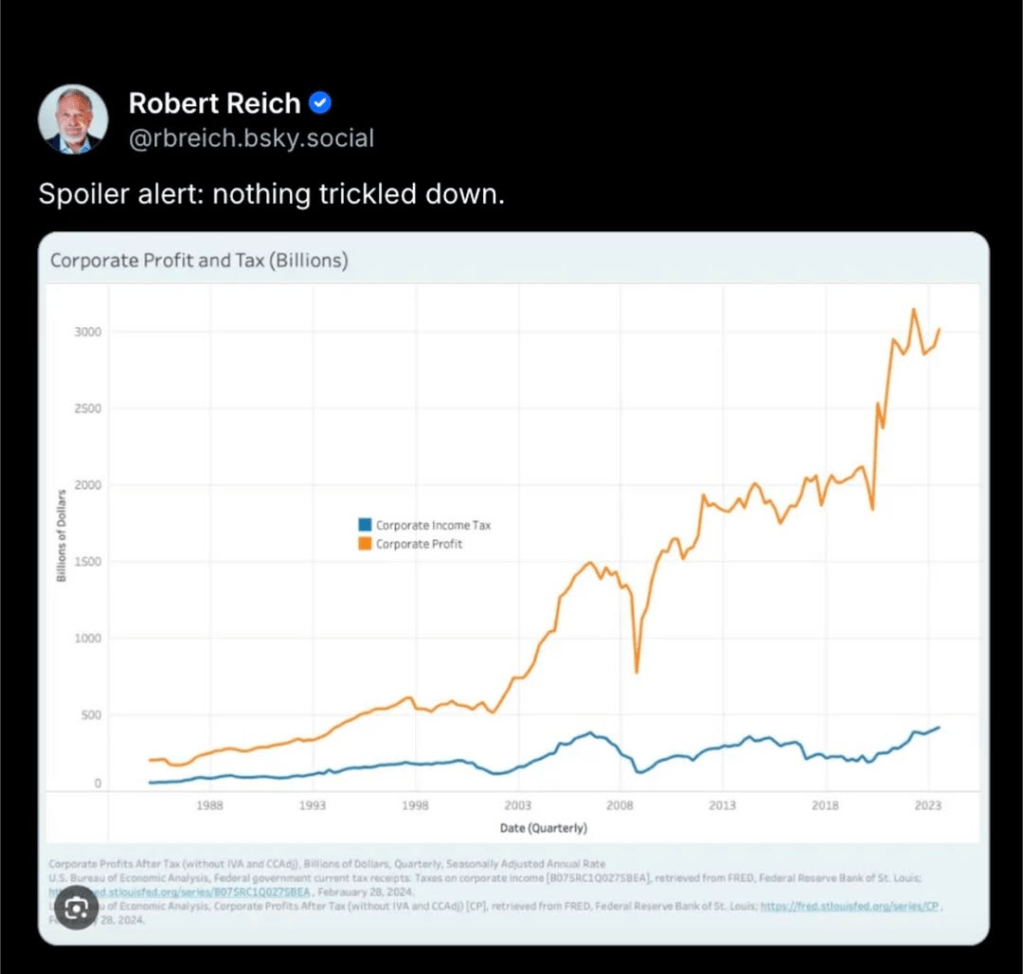
- Post-1980: steady decline
- Post-2017: flat 21% (historic low)
👨👩👧 Middle Class
- Strongest when:
- Taxes were more progressive
- Unions stronger
- Wage growth broad-based
- Decline correlates with:
- Globalization
- Automation
- Tax + policy shifts
6) Big Picture
Trend Direction (1950 → 2026)
Individual top tax rates⬇️ Huge decrease
Corporate tax rates⬇️ Large decrease
Middle class share⬇️ Moderate decline
